Goal
The goal of Cuttlefish is to create visualizations that provide a more intuitive representation of geographically distributed data with strong diurnal patterns. The tool displays data points overlapped on the image of a geographical map. It uses variations in height and color to show the amplitude of the data points and a sweeping terminator to highlight day/night changes. The image may also include a summary histogram and/or a color legend.
Cuttlefish sums the values associated with overlapping geographic regions that must fit into the smallest data display unit of 2 pixels wide by 1 pixel high. Therefore, if several data points are so close geographically that they render in the same screen position, the sum of their values is displayed at this location. Because of this approach, Cuttlefish only works well for values that are cumulative e.g. number of hosts, byte counts, or packets. The tool is not appropriate for data that are normally represented as an average or median such as packet Round Trip Times (RTT).
Features
Cuttlefish is a configurable visualization tool. Driven by the parameters and data in its configuration file, Cuttlefish displays:
- geographical map(s),
- color coded data drawn to specific lat/lon locations,
- a moving line showing the border between night and day,
- optional color legend,
- optional global histogram,
- a single image, a collection of temporally related images, or a combined animated GIF.
Code
- Cuttlefish release directory stores the current version of Cuttlefish.
- README outlines the file manifest and code dependencies.
- README.config outlines the configuration and data file format and provides a sample configuration file. Each image or animation requires its own unique configuration file.
Execution
While cuttlefish does recognize several command-line options, for most images or animations, it requires only the path and name of the configuration file.
% cuttlefish /path/to/config_file
For the complete list of command-line options, run cuttlefish with a '-h'.
Examples
The following examples show how one can use Cuttlefish to visualize geographically distributed, time-series data characterized by fairly strong diurnal patterns.

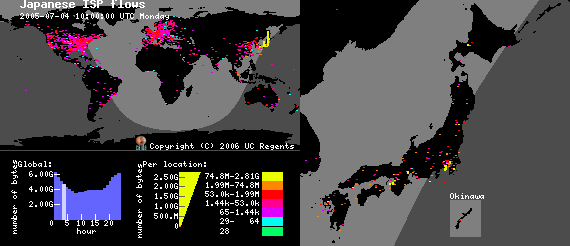
Traffic flowing through a Japanese ISP (click for animated version)

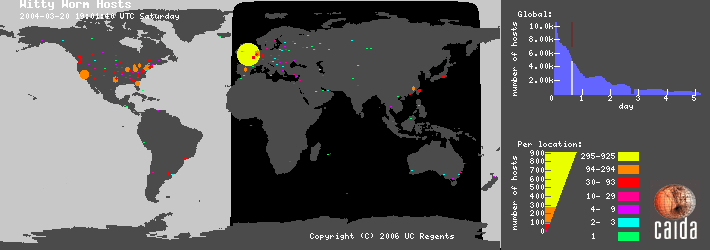
Hosts infected by the Witty Internet Worm (click for animated version)


 Cuttlefish produces animated GIFs that reveal the interplay
between the diurnal and geographical patterns of displayed data.
By showing how the sun's shadow covers the world map,
Cuttlefish clearly depicts the time of day at a
given geographic region, while moving graphs illustrate the
relationship between local time and the visualized events.


